Putting Data On The Map
- Darren David
Fluid / darren-ff@fluid.com - Michal Migurski
Stamen / mike-ff@teczno.com
These slides available at clients.stamen.com/talks/ffnyc/.
Demo files available at clients.stamen.com/talks/ffnyc/demo.tar.gz (updated July 7 2005 10:25am EDT).
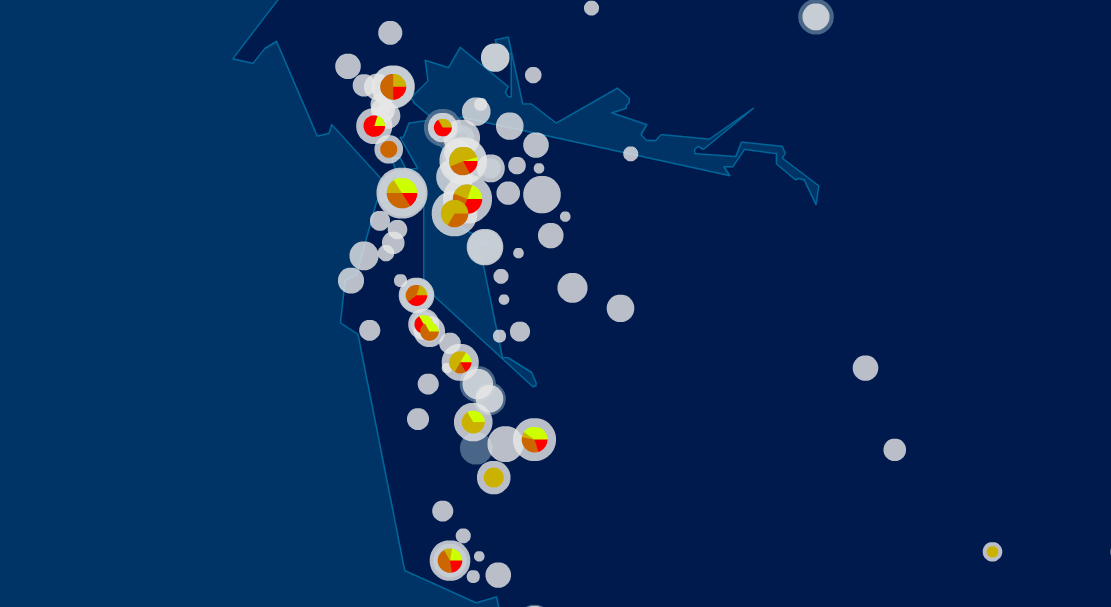
Example: Mappr
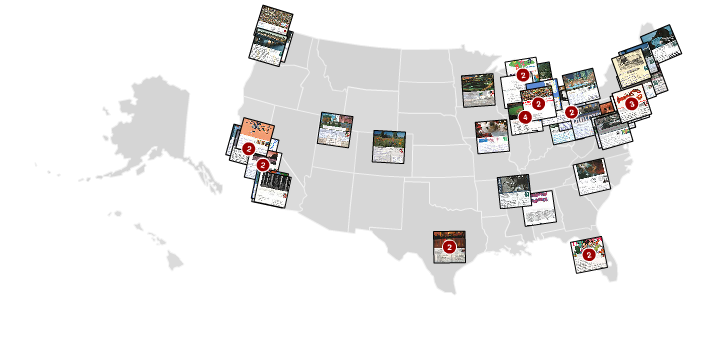
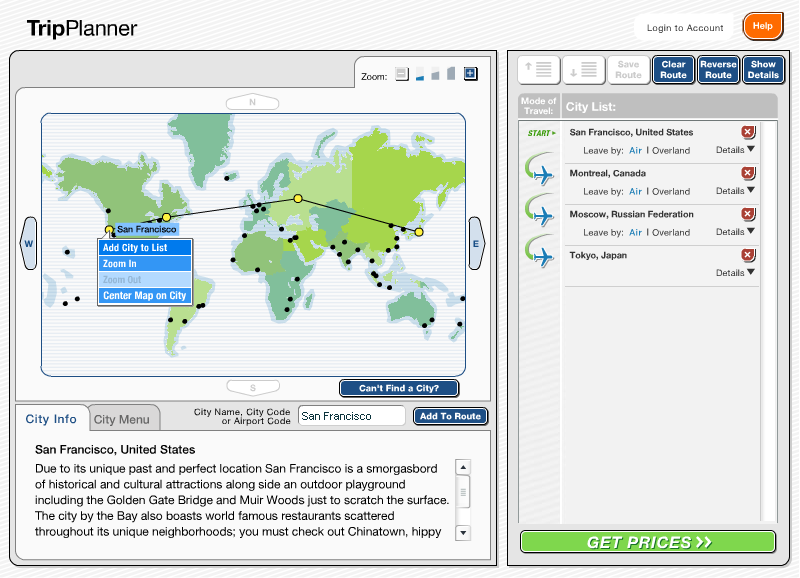
Example: AirTreks
Example: MoveOn Virtual Town Hall
Where To Start
- Acquire
- Translate
- Project
- Transform
- Plot
- Interact
Demo: MapDemo.swf, code samples: demo.tar.gz (updated July 7 2005 10:25am EDT).
Acquire: Data sources
- GPS
- Postal codes
- Government Resources
GNS, GNIS - Direct Manipulation of a map-like UI
GeoBloggers
Acquire: Maps
- Free
Perry-Castañeda Collection, National Atlas, your local city hall. - Not Free
Not necessarily expensive, but may be royalty-encumbered
Map Resources
Translate: Geo Data
What does geospatial data look like?
- Coordinates pairs.
- Latitude & longitude rather than x & y.
- These range +/- 180 degrees.
Translate: Flash Geo Data
Simplest case: 3-member tuples with a latitude, longitude, and identifiers.
var lower48MapCityData : Array =
    [
        {
          name : "San Francisco, California",
          lat  : 37.77,
          long : -122.43
        },

        {
          name : "Bethesda, Maryland",
          lat  : 39.00,
          long : -77.11
        }
    ];
Translate: XML Geo Data
Modified example from Mappr. We do the projection server-side (more on that in a minute), using a Lambert Azimuthal Equal Area projection centered on 45°N 100°W.
<?xml version="1.0" encoding="utf-8" ?>
<points>
  <point name="San Francisco, California">
    <geo latitude="37.77" longitude="-122.43" />
    <projected x="-262.14" y="73.43" />
  </point>
  <point name="Bethesda, Maryland">
    <geo latitude="39.00" longitude="-77.11" />
    <projected x="262.65" y="53.86" />
  </point>
</points>
Project: Definition
- Projections are ways to flatten the 3D surface of a sphere onto the flat 2D surface of a map or screen.
- Typical examples include Mercator’s projection, Lambert’s Equal Area projection, and Albers’ Equal Area projection.
- Lots more tasty math at Mathworld.com
Project: Example Step 1
Start with a 3-dimensional globe:

Project: Example Step 2
Raw projection, centered on Europe:
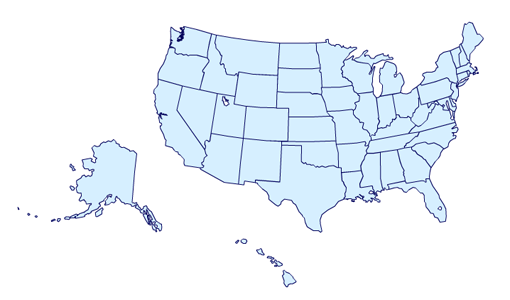
Project: Example Step 3
A specific map based on part of a projection:
Transform: Why
- Each projection method gives you a “universal” x & y coordinate—totally raw, totally useless on its own.
- You’re going to need to take the raw output of the projection equations, and convert them to the local coordinates of your map.
- To do this, you will use affine transformations, i.e. a combination of scaling, rotation, and translation.
- In other words, linear algebra.
Transform: How
- Unfortunately, the math is a little hairy.
- Fortunately, we have written code that does it for you.
You need only know the specific projection used, and three well-chosen reference points.
Plot: Optimize
- Attach your x & y points to the map.
- Many points may be outside the visible boundaries, if you have the map zoomed-in to a small area. Use
hitTestto avoid drawing these.
Plot: Ambiguity
- What happens when points are too close to one another at a given zoom level?
- One approach: use a clustering algorithm to determine crowding levels in various spots, and move the points to give them more room. This is hard, thankless work for the CPU.
- Another approach: give each point a minimum zoom level in the data source. Much easier, if you know them all ahead of time.
Plot: Niceties
- Mappr
Plotted images are rotated along parallels. - AirTreks
Draws your route by connecting points and scrolling around the world. - MoveOn
“Kirby dots” for layered metadata presentation.
Interact: Points
- Contextual menus
- Popups with high-detail information
Interact: Map
- Zoom
- Pan
- It’s hard to do both; often you need to introduce keyboard modifier keys or limit a dimension of interaction.
The End
Copy of these slides available at clients.stamen.com/talks/ffnyc/. Demo files available at clients.stamen.com/talks/ffnyc/demo.tar.gz (updated July 7 2005 10:25am EDT).
Questions?